
On this page
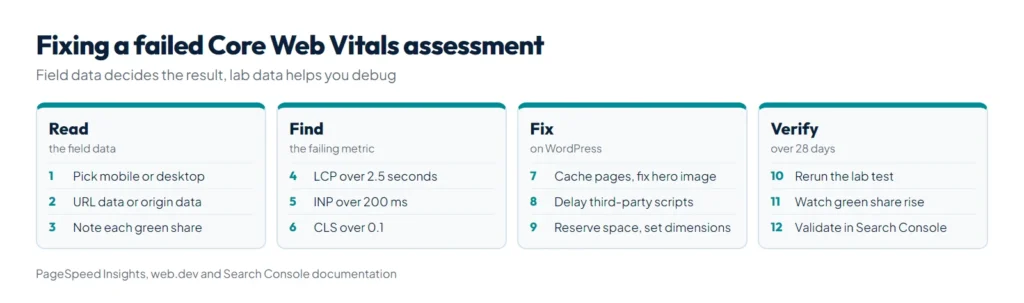
“Core Web Vitals Assessment: Failed” in PageSpeed Insights means that, in the last 28 days of real Chrome visits, at least one Core Web Vital was not good at the 75th percentile: Largest Contentful Paint above 2.5 seconds, Interaction to Next Paint above 200 milliseconds or Cumulative Layout Shift above 0.1. It comes from field data, not from the performance score below it, so a WordPress page can score 95 and still fail. Below: how to read the report, which metric to fix and how, and why it takes up to 28 days to turn green.
We build WordPress sites for businesses in Pakistan and test each one in PageSpeed Insights before and after launch. The rules below come from Google’s own documentation for PageSpeed Insights, Search Console and the Chrome UX Report. For a general speed checklist, see our WordPress speed optimization guide. This post is about passing the assessment.
What does “Core Web Vitals assessment failed” mean?
Google’s About PageSpeed Insights page sets the rules. A page, or a whole origin, passes when the 75th percentile of all three metrics is Good. If there is not enough INP data, it passes when LCP and CLS are both Good. If LCP or CLS lacks data, it cannot be assessed at all. The thresholds:
| Metric | Good | Needs improvement | Poor | In the assessment? |
|---|---|---|---|---|
| Largest Contentful Paint (LCP) | 2.5 s or less | 2.5 to 4 s | Over 4 s | Yes |
| Interaction to Next Paint (INP) | 200 ms or less | 200 to 500 ms | Over 500 ms | Yes |
| Cumulative Layout Shift (CLS) | 0.1 or less | 0.1 to 0.25 | Over 0.25 | Yes |
| First Contentful Paint (FCP) | 1.8 s or less | 1.8 to 3 s | Over 3 s | No, diagnostic |
| Time to First Byte (TTFB) | 0.8 s or less | 0.8 to 1.8 s | Over 1.8 s | No, experimental |
“At the 75th percentile” means: sort every recorded visit from fastest to slowest and take the value that 75% of visits match or beat. For LCP to be Good, at least three visits in four must show the main content within 2.5 seconds. web.dev’s Web Vitals overview adds that the 75th percentile is measured separately for mobile and desktop, so a page can pass on one and fail on the other.
How do you read the PageSpeed Insights report?
- Pick Mobile or Desktop. Each has its own assessment, and Search Console rates them separately too.
- Check whether the data is for this URL or the origin. When a page lacks enough real visits, PageSpeed Insights falls back to the origin, meaning every page on the site. A failing origin can be dragged down by other templates, such as shop or category pages, not the page you tested.
- Read the colored bars. Each metric shows the share of visits that were Good (green), Needs improvement (amber) and Poor (red), with the 75th percentile value above them. The green share tells you how far you are from passing: it has to reach 75%.
- Treat the performance score as a diagnostic. It is one Lighthouse run that simulates a mid-tier phone on a mobile network, from a Google data center in North America, Europe or Asia, not from your visitors’ connections. Google calls 90 or above good, but the score does not decide the assessment.
- Understand “No data”. The page is not in the Chrome UX Report. New and low-traffic WordPress sites often have no field data, so use the lab results until they do.
Field data also leaves some visitors out. The Chrome UX Report methodology collects only from Chrome on desktop and Android. Chrome on iOS, Android apps that open pages in a WebView and other Chromium browsers such as Edge are excluded, and a page must return status 200, not be noindexed and pass a minimum visitor count that Google does not disclose.
Why does a page with a high score still fail?
Google’s article on why lab and field data differ explains the gap. On WordPress sites, these are the usual reasons:
| Reason | What it looks like on WordPress |
|---|---|
| One simulated load against thousands of real ones | Visitors on mid-range phones and mobile data get a slower LCP than the lab run. |
| A different LCP element | On real screens the largest element may be a slider image or a personalized block for logged-in users, not the text the lab picked. |
| Field CLS covers the whole visit | Lab CLS only covers loading above the fold. Real visitors scroll into lazy-loaded images, embeds and ads that have no reserved space. |
| INP needs real taps | The lab shows Total Blocking Time as a stand-in. A tap that lands while a chat widget or slider script is busy only counts in the field. |
| No mobile viewport tag | Browsers add a 300 ms delay after each tap, which hurts INP but does not show in Total Blocking Time. |
The gap can run the other way too: cached files and the back/forward cache often make real visits faster than the lab.
How do you fix each failing metric on WordPress?
Fix the metric that fails, on the device where it fails. The diagnostics in PageSpeed Insights name the LCP element and the elements that shifted, which tells you where to start.
| Failing metric | Usual WordPress cause | Fix |
|---|---|---|
| LCP | Slow server or no page cache (TTFB over 0.8 s); a hero image set as a CSS background, inside a slider or lazy-loaded; an oversized hero photo | Page caching and a current PHP version; a normal image tag for the hero, not lazy-loaded; resize it and serve WebP or AVIF |
| INP | Chat widgets, popups, sliders, mega menus and tag scripts busy when visitors tap; very large page-builder layouts | Remove or delay third-party scripts, load plugin scripts only on pages that use them, simplify the heaviest templates |
| CLS | Images and iframes without width and height; ads, embeds and cookie banners that push content down; late web fonts | Set dimensions, reserve space for embeds and ads, make banners overlay the page, preload the main font |
Our speed guide splits LCP into its four parts and lists the fixes in the order we apply them. If TTFB is the slow part, the host matters most, and our guide to WordPress hosting in Pakistan shows what to check. To try newer fixes, the WordPress Performance Team’s Performance Lab plugin offers feature plugins such as Image Prioritizer and Embed Optimizer, but its own page calls it mostly a beta testing plugin, so test it on staging first.
When every template fails because of a heavy theme or page builder, patching has limits. Our website development team builds lean WordPress sites and checks them against these thresholds before launch.
Why does it take 28 days to turn green?
PageSpeed Insights’ field data covers a trailing 28-day period and is updated daily. After a fix, each new day adds faster visits and one old day drops out, so the 75th percentile moves gradually. You can estimate the wait from the green bar of the failing metric:
days to pass = 28 x (75 - green now) / (green after the fix - green now)A worked example with made-up numbers: the mobile LCP bar shows 60% green, and after the fix 90% of new visits load the main content within 2.5 seconds. That gives 28 x (75 – 60) / (90 – 60) = 14 days. If the fix only reaches 80% green, it takes 28 x 15 / 20 = 21 days. If new visits stay under 75% green, the page never passes, however long you wait. The estimate assumes steady daily traffic and the same mix of devices.
Search Console uses the same 28-day data. Its Core Web Vitals report groups similar URLs, gives each group the status of its worst metric, and when you start tracking a fix it runs a 28-day monitoring session. The issue counts as fixed only if no URL on the site shows it during that window. While you wait, confirm each change with a fresh lab test and watch the green share rise in PageSpeed Insights.
Summary
“Core Web Vitals assessment failed” means that over the last 28 days of real Chrome visits on that device type, LCP, INP or CLS missed its Good threshold at the 75th percentile: 2.5 seconds, 200 milliseconds or 0.1. Check whether the data is for the URL or the whole origin, find the failing metric and its element, fix that metric on WordPress, and expect the field data to turn green gradually over up to 28 days, sooner when the fix is bigger. Our website development team builds WordPress sites that pass, and our speed optimization guide covers everything else that makes a site fast.
References
- About PageSpeed Insights, Google for Developers
- Web Vitals, web.dev
- Why lab and field data can be different, web.dev
- CrUX methodology, Chrome for Developers
- Core Web Vitals report, Search Console Help
- Understanding Core Web Vitals and Google search results, Google Search Central
- Performance Lab, WordPress.org plugin directory